Skip to content

Koh Samui, by people who live here

Weather now

Typical for October

Koh Samui weather, right now and for the rest of your trip

What October usually brings, the next seven days, the calm side of the island, the whole year and twenty years of what the weather actually did.

Typical for October

1991-2020 averages

Typical high

31°C

Rain likely

Rain days
16/ 31
Rain
295 mm
Sun
4.5 h
Humidity
85%
  • Highs / lows

    30.6° / 24.3°

    Records 35.8° and 21.4°

  • Rain chance

    52 %

    16 of 31 days, 295 mm a month

  • Sun

    4.5 h

    hours of sunshine a day

  • Sunset

    17:58

    Sunrise 06:10

  • Sea

    29 °C

    Humidity 85%

  • Calm coasts

    0 of 4

    None reliably calm

Typical values: 1991-2020 averages for October at the Ko Samui station, sea state from our month-by-month coast notes. Live readings replace them when available.

The sea, coast by coast

The four coasts do not turn rough together: the monsoon wind decides which side is sheltered. This is what each coast usually does in October, with its whole year beside it.

Sea state in October

Sea state from our own month-by-month coast notes, the same ones as on the beaches page. No buoy measures the sea around Samui.

North coast

Maenam, Bophut, Choeng Mon

Usually

Choppy

  1. January: Calm
  2. February: Calm
  3. March: Calm
  4. April: Calm
  5. May: Calm
  6. June: Calm
  7. July: Calm
  8. August: Calm
  9. September: Calm
  10. October: Choppy
  11. November: Choppy
  12. December: Choppy

East coast

Chaweng, Lamai, Coral Cove

Usually

Rough

  1. January: Choppy
  2. February: Calm
  3. March: Calm
  4. April: Calm
  5. May: Calm
  6. June: Calm
  7. July: Calm
  8. August: Calm
  9. September: Choppy
  10. October: Rough
  11. November: Rough
  12. December: Choppy

South coast

Bang Kao, Na Khai, Laem Set

Usually

Choppy

  1. January: Calm
  2. February: Calm
  3. March: Calm
  4. April: Calm
  5. May: Choppy
  6. June: Choppy
  7. July: Choppy
  8. August: Choppy
  9. September: Choppy
  10. October: Choppy
  11. November: Choppy
  12. December: Calm

West coast

Lipa Noi, Taling Ngam, Nathon

Usually

Rough

  1. January: Calm
  2. February: Calm
  3. March: Calm
  4. April: Calm
  5. May: Choppy
  6. June: Choppy
  7. July: Choppy
  8. August: Choppy
  9. September: Choppy
  10. October: Rough
  11. November: Rough
  12. December: Calm

This week

Seven days, scan and compare

The next 7 days

The dates are real, the numbers are what each day's month usually brings. Use them to pack and plan; a live forecast takes their place when we have one.

Typical for the season

  1. Today31 Oct Rain likely 30.6°24.3° 52% chance 18 mm on a wet day 06:10 17:58 29°C 0 of 4 Beach: Skip Boat trip: Maybe Hike: Skip
  2. Sun1 Nov Rain likely 29.7°24.1° 53% chance 28 mm on a wet day 06:10 17:57 29°C 0 of 4 Beach: Skip Boat trip: Maybe Hike: Skip
  3. Mon2 Nov Rain likely 29.7°24.1° 53% chance 28 mm on a wet day 06:10 17:57 29°C 0 of 4 Beach: Skip Boat trip: Maybe Hike: Skip
  4. Tue3 Nov Rain likely 29.7°24.1° 53% chance 28 mm on a wet day 06:10 17:57 29°C 0 of 4 Beach: Skip Boat trip: Maybe Hike: Skip
  5. Wed4 Nov Rain likely 29.7°24.1° 53% chance 28 mm on a wet day 06:11 17:57 29°C 0 of 4 Beach: Skip Boat trip: Maybe Hike: Skip
  6. Thu5 Nov Rain likely 29.7°24.1° 53% chance 28 mm on a wet day 06:11 17:57 29°C 0 of 4 Beach: Skip Boat trip: Maybe Hike: Skip
  7. Fri6 Nov Rain likely 29.7°24.1° 53% chance 28 mm on a wet day 06:11 17:56 29°C 0 of 4 Beach: Skip Boat trip: Maybe Hike: Skip

A typical day in October

Saturday 31 October

16 rain days in 31, about 18 mm on a wet day, highs near 30.6°C and the sea at 29°C. Sun up 06:10, down 17:58.

  • Beach Skip 0 of 4 coasts calm, 16 rain days
  • Boat trip Maybe 2 of 4 coasts rough
  • Hike Skip 16 rain days in the month
How we judge a day

Beach: go with two or more calm coasts and 12 rain days or fewer, skip when no coast is calm, otherwise maybe. Boat trip: go when no coast is rough, maybe with one or two rough coasts, skip with three or more. Hike: go up to 10 rain days, maybe up to 14, skip above that (trails turn slippery).

Dates in Bangkok time. Numbers are the 1991-2020 averages for each day's month; sunrise and sunset are calculated for the date.

Further ahead

For the optimists

Coming later? What we can honestly say

A forecast is sharp for a few days, then blurs into tendencies, then into climate odds. Here is how far each kind of outlook reaches, and what the averages say about the months ahead.

This week days 1 to 7 Forecast
Next week days 8 to 15 Tendency
The weeks after weeks 3 to 6 A lean
Months ahead 1 to 6 months Climate odds

The next four months, by the averages

Climate odds

Rain per month on the same scale, with rain days and highs. A typical month, not a forecast for this year.

  1. 445 November 445 mm, 16 rain days highs 29.7°C, sea 29°C
  2. 265 December 265 mm, 12 rain days highs 29.3°C, sea 28.5°C
  3. 125 January 125 mm, 8 rain days highs 29°C, sea 28°C
  4. 65 February 65 mm, 4 rain days highs 29.4°C, sea 28.5°C

1991-2020 normals for the Ko Samui station (WMO 48550).

The year

Twelve months, six ways to read them

Samui's seasons, from every angle

Samui runs on its own calendar: dry and sunny from February to April, hot into June, only lightly wet while the Andaman coast drowns, then the northeast monsoon from October. Turn the dial to any month.

January 125 mm in 8 rain days

February 65 mm in 4 rain days

March 115 mm in 5 rain days

April 85 mm in 6 rain days

May 130 mm in 11 rain days

June 135 mm in 10 rain days

July 115 mm in 11 rain days

August 100 mm in 10 rain days

September 120 mm in 11 rain days

October 295 mm in 16 rain days

November 445 mm in 16 rain days

December 265 mm in 12 rain days

Petals: rain in mm a month. Rings: the seasons.

Northeast monsoon rains

January

  • Highs / lows

    29° / 24.2°

  • Rain

    125 mm, 8 days

  • Sun

    6.5 h a day

  • Sea

    28 °C

  • Humidity

    83 %

  • Dry days

    23 / 31

  • Calm coasts

    3 of 4

  • Waterfalls running

    9 of 11

  • Sun up, down

    06:40 / 18:18

Station records for January: wettest day 389.9 mm (8 Jan 1975), hottest 33.4°C, coolest 18.6°C. Crowds high, hotel prices high.

January on Samui

Dry and sunny

February

  • Highs / lows

    29.4° / 24.9°

  • Rain

    65 mm, 4 days

  • Sun

    7.5 h a day

  • Sea

    28.5 °C

  • Humidity

    81 %

  • Dry days

    24 / 28

  • Calm coasts

    4 of 4

  • Waterfalls running

    7 of 11

  • Sun up, down

    06:39 / 18:29

Station records for February: wettest day 191 mm (1 Feb 1987), hottest 35.1°C, coolest 17.8°C. Crowds high, hotel prices high.

February on Samui

Dry and sunny

March

  • Highs / lows

    30.4° / 25.4°

  • Rain

    115 mm, 5 days

  • Sun

    7.5 h a day

  • Sea

    29 °C

  • Humidity

    81 %

  • Dry days

    26 / 31

  • Calm coasts

    4 of 4

  • Waterfalls running

    2 of 11

  • Sun up, down

    06:28 / 18:31

Station records for March: wettest day 307.3 mm (28 Mar 2011), hottest 36°C, coolest 21°C. Crowds medium, hotel prices medium.

March on Samui

Dry and sunny Hot months

April

  • Highs / lows

    31.8° / 26°

  • Rain

    85 mm, 6 days

  • Sun

    6.5 h a day

  • Sea

    30 °C

  • Humidity

    81 %

  • Dry days

    24 / 30

  • Calm coasts

    4 of 4

  • Waterfalls running

    0 of 11

  • Sun up, down

    06:10 / 18:30

Station records for April: wettest day 113.8 mm (5 Apr 2022), hottest 38°C, coolest 22°C. Crowds medium, hotel prices medium.

April on Samui

Hot months

May

  • Highs / lows

    32.9° / 25.7°

  • Rain

    130 mm, 11 days

  • Sun

    6 h a day

  • Sea

    30 °C

  • Humidity

    80 %

  • Dry days

    20 / 31

  • Calm coasts

    2 of 4

  • Waterfalls running

    2 of 11

  • Sun up, down

    05:59 / 18:33

Station records for May: wettest day 126.2 mm (4 May 2022), hottest 37.8°C, coolest 22.1°C. Crowds low, hotel prices low.

May on Samui

Hot months Light southwest monsoon

June

  • Highs / lows

    32.7° / 25.3°

  • Rain

    135 mm, 10 days

  • Sun

    5 h a day

  • Sea

    30 °C

  • Humidity

    78 %

  • Dry days

    20 / 30

  • Calm coasts

    2 of 4

  • Waterfalls running

    4 of 11

  • Sun up, down

    06:00 / 18:40

Station records for June: wettest day 87.9 mm (9 Jun 1996), hottest 38.2°C, coolest 20.6°C. Crowds low, hotel prices low.

June on Samui

Light southwest monsoon

July

  • Highs / lows

    32.3° / 25.1°

  • Rain

    115 mm, 11 days

  • Sun

    5 h a day

  • Sea

    29.5 °C

  • Humidity

    78 %

  • Dry days

    20 / 31

  • Calm coasts

    2 of 4

  • Waterfalls running

    5 of 11

  • Sun up, down

    06:07 / 18:45

Station records for July: wettest day 119.1 mm (4 Jul 1998), hottest 37.7°C, coolest 19.9°C. Crowds medium, hotel prices low.

July on Samui

Light southwest monsoon

August

  • Highs / lows

    32.4° / 25.1°

  • Rain

    100 mm, 10 days

  • Sun

    5 h a day

  • Sea

    29.5 °C

  • Humidity

    78 %

  • Dry days

    21 / 31

  • Calm coasts

    2 of 4

  • Waterfalls running

    7 of 11

  • Sun up, down

    06:12 / 18:38

Station records for August: wettest day 101.6 mm (20 Aug 2020), hottest 37.2°C, coolest 21.7°C. Crowds medium, hotel prices medium.

August on Samui

Light southwest monsoon

September

  • Highs / lows

    31.9° / 24.8°

  • Rain

    120 mm, 11 days

  • Sun

    5 h a day

  • Sea

    29 °C

  • Humidity

    80 %

  • Dry days

    19 / 30

  • Calm coasts

    1 of 4

  • Waterfalls running

    10 of 11

  • Sun up, down

    06:10 / 18:21

Station records for September: wettest day 116.1 mm (22 Sept 1983), hottest 36.4°C, coolest 19.4°C. Crowds low, hotel prices low.

September on Samui

Northeast monsoon rains

October This month

  • Highs / lows

    30.6° / 24.3°

  • Rain

    295 mm, 16 days

  • Sun

    4.5 h a day

  • Sea

    29 °C

  • Humidity

    85 %

  • Dry days

    15 / 31

  • Calm coasts

    0 of 4

  • Waterfalls running

    11 of 11

  • Sun up, down

    06:08 / 18:03

Station records for October: wettest day 210.1 mm (22 Oct 1998), hottest 35.8°C, coolest 21.4°C. Crowds low, hotel prices low.

October on Samui

Northeast monsoon rains

November

  • Highs / lows

    29.7° / 24.1°

  • Rain

    445 mm, 16 days

  • Sun

    6 h a day

  • Sea

    29 °C

  • Humidity

    86 %

  • Dry days

    14 / 30

  • Calm coasts

    0 of 4

  • Waterfalls running

    11 of 11

  • Sun up, down

    06:14 / 17:56

Station records for November: wettest day 464.1 mm (24 Nov 1988), hottest 34°C, coolest 19.6°C. Crowds low, hotel prices low.

November on Samui

Northeast monsoon rains

December

  • Highs / lows

    29.3° / 24°

  • Rain

    265 mm, 12 days

  • Sun

    5.5 h a day

  • Sea

    28.5 °C

  • Humidity

    83 %

  • Dry days

    19 / 31

  • Calm coasts

    2 of 4

  • Waterfalls running

    9 of 11

  • Sun up, down

    06:28 / 18:02

Station records for December: wettest day 207.8 mm (14 Dec 2024), hottest 32.3°C, coolest 18.8°C. Crowds high, hotel prices high.

December on Samui

Six ways to read JanuarySix ways to read FebruarySix ways to read MarchSix ways to read AprilSix ways to read MaySix ways to read JuneSix ways to read JulySix ways to read AugustSix ways to read SeptemberSix ways to read OctoberSix ways to read NovemberSix ways to read December

Each card rates the chosen month from our own numbers; the strip shows the whole year, the chosen month outlined. The rule behind each rating is printed under it.

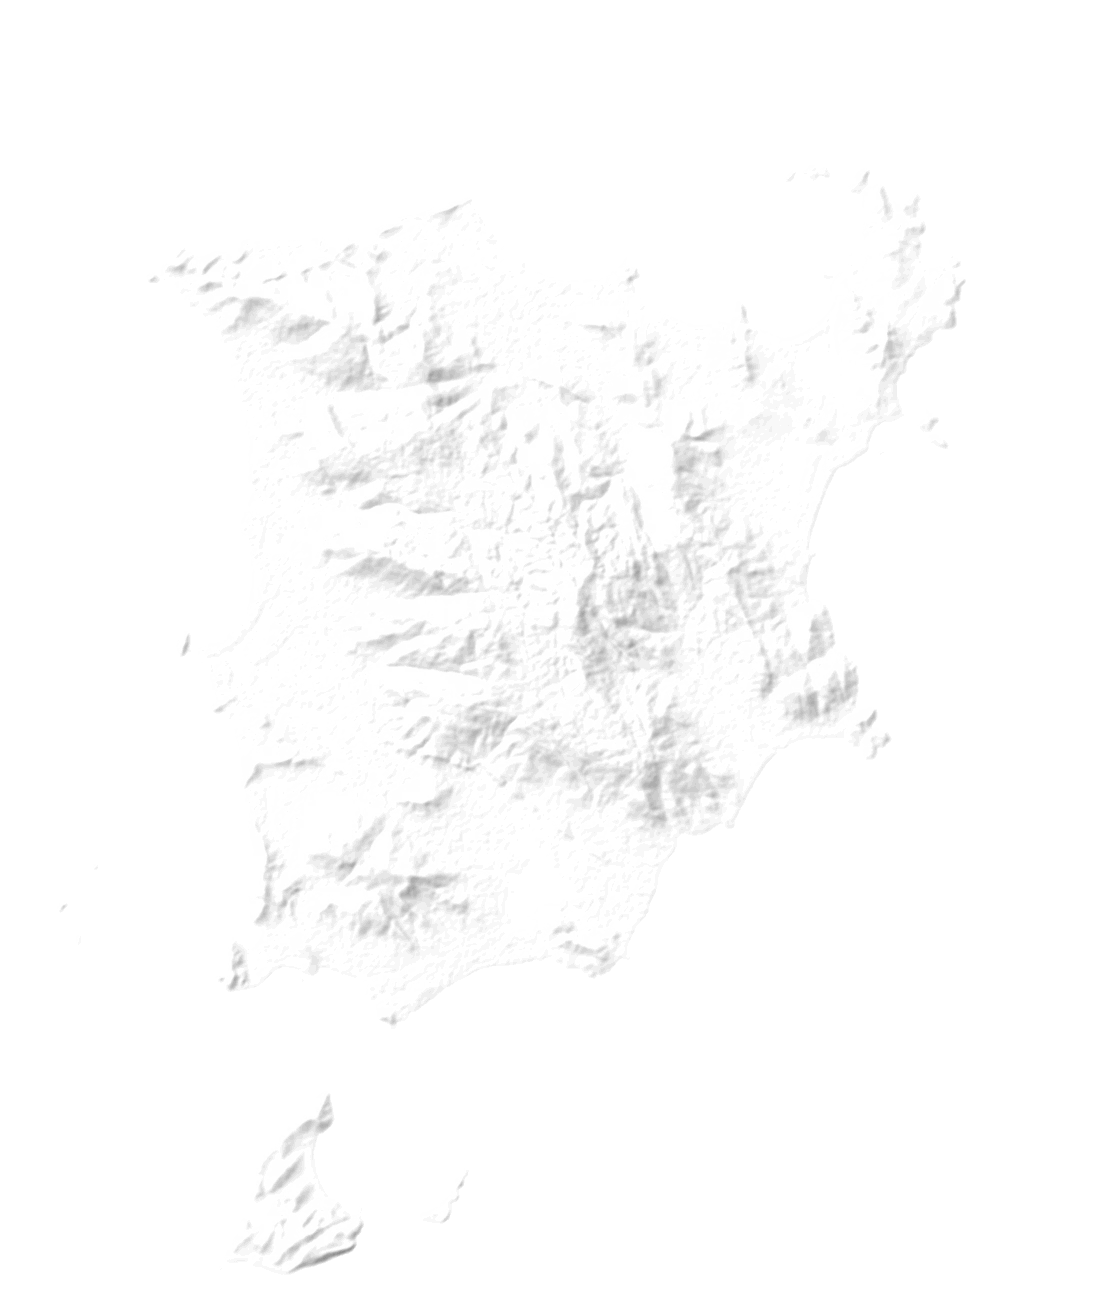
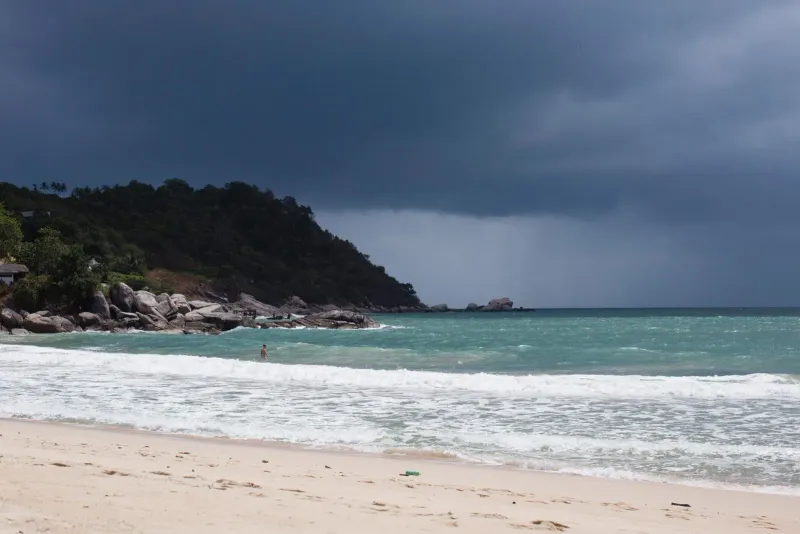
Turquoise bay below jungle and granite boulders

Beach and swim

Great 3 of 4 coasts calm, 8 rain days, sea 28°C

Great 4 of 4 coasts calm, 4 rain days, sea 28.5°C

Great 4 of 4 coasts calm, 5 rain days, sea 29°C

Great 4 of 4 coasts calm, 6 rain days, sea 30°C

Good 2 of 4 coasts calm, 11 rain days, sea 30°C

Good 2 of 4 coasts calm, 10 rain days, sea 30°C

Good 2 of 4 coasts calm, 11 rain days, sea 29.5°C

Good 2 of 4 coasts calm, 10 rain days, sea 29.5°C

Mixed 1 of 4 coasts calm, 11 rain days, sea 29°C

Poor 0 of 4 coasts calm, 16 rain days, sea 29°C

Poor 0 of 4 coasts calm, 16 rain days, sea 29°C

Mixed 2 of 4 coasts calm, 12 rain days, sea 28.5°C

  1. January: Great
  2. February: Great
  3. March: Great
  4. April: Great
  5. May: Good
  6. June: Good
  7. July: Good
  8. August: Good
  9. September: Mixed
  10. October: Poor
  11. November: Poor
  12. December: Mixed

Calm coasts out of four and rain days (great: 3 or 4 calm coasts and 8 rain days or fewer; over 200 mm of rain caps a month at mixed).

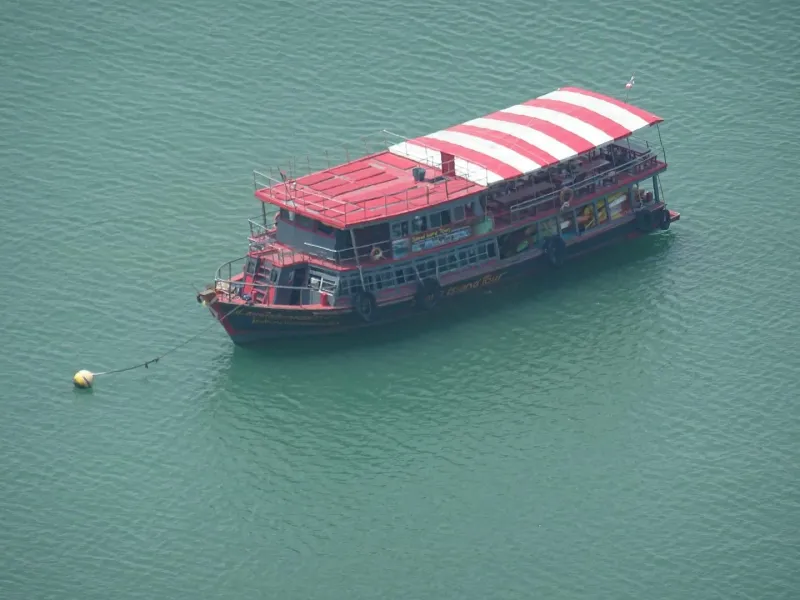
A tour boat waiting to take visitors from Samui to Ang Thong

Boat trips

Great 0 of 4 coasts rough, 3 calm

Great 0 of 4 coasts rough, 4 calm

Great 0 of 4 coasts rough, 4 calm

Great 0 of 4 coasts rough, 4 calm

Good 0 of 4 coasts rough, 2 calm

Good 0 of 4 coasts rough, 2 calm

Good 0 of 4 coasts rough, 2 calm

Good 0 of 4 coasts rough, 2 calm

Good 0 of 4 coasts rough, 1 calm

Mixed 2 of 4 coasts rough, 0 calm

Mixed 2 of 4 coasts rough, 0 calm

Good 0 of 4 coasts rough, 2 calm

  1. January: Great
  2. February: Great
  3. March: Great
  4. April: Great
  5. May: Good
  6. June: Good
  7. July: Good
  8. August: Good
  9. September: Good
  10. October: Mixed
  11. November: Mixed
  12. December: Good

Rough coasts out of four (great: none rough and 3 or 4 calm; any rough coast makes a month mixed, three or more poor).

A waterfall in full flow after rain, a walker with an umbrella below

Hiking and waterfalls

Great 9 of 11 waterfalls running, 8 rain days, highs 29°C

Good 7 of 11 waterfalls running, 4 rain days, highs 29.4°C

Mixed 2 of 11 waterfalls running, 5 rain days, highs 30.4°C

Poor 0 of 11 waterfalls running, 6 rain days, highs 31.8°C

Mixed 2 of 11 waterfalls running, 11 rain days, highs 32.9°C

Mixed 4 of 11 waterfalls running, 10 rain days, highs 32.7°C

Good 5 of 11 waterfalls running, 11 rain days, highs 32.3°C

Good 7 of 11 waterfalls running, 10 rain days, highs 32.4°C

Great 10 of 11 waterfalls running, 11 rain days, highs 31.9°C

Mixed 11 of 11 waterfalls running, 16 rain days, highs 30.6°C

Mixed 11 of 11 waterfalls running, 16 rain days, highs 29.7°C

Great 9 of 11 waterfalls running, 12 rain days, highs 29.3°C

  1. January: Great
  2. February: Good
  3. March: Mixed
  4. April: Poor
  5. May: Mixed
  6. June: Mixed
  7. July: Good
  8. August: Good
  9. September: Great
  10. October: Mixed
  11. November: Mixed
  12. December: Great

Waterfalls running out of eleven, rain days and heat (15 rain days or more makes trails slippery).

A family building in the sand under palm trees

Families

Great 3 of 4 coasts calm, highs 29°C, high crowds

Great 4 of 4 coasts calm, highs 29.4°C, high crowds

Great 4 of 4 coasts calm, highs 30.4°C, medium crowds

Great 4 of 4 coasts calm, highs 31.8°C, medium crowds

Mixed 2 of 4 coasts calm, highs 32.9°C, low crowds

Mixed 2 of 4 coasts calm, highs 32.7°C, low crowds

Good 2 of 4 coasts calm, highs 32.3°C, medium crowds

Good 2 of 4 coasts calm, highs 32.4°C, medium crowds

Mixed 1 of 4 coasts calm, highs 31.9°C, low crowds

Poor 0 of 4 coasts calm, highs 30.6°C, low crowds

Poor 0 of 4 coasts calm, highs 29.7°C, low crowds

Mixed 2 of 4 coasts calm, highs 29.3°C, high crowds

  1. January: Great
  2. February: Great
  3. March: Great
  4. April: Great
  5. May: Mixed
  6. June: Mixed
  7. July: Good
  8. August: Good
  9. September: Mixed
  10. October: Poor
  11. November: Poor
  12. December: Mixed

Calm water, rain days and heat (highs of 32.5°C or more knock a month down one step).

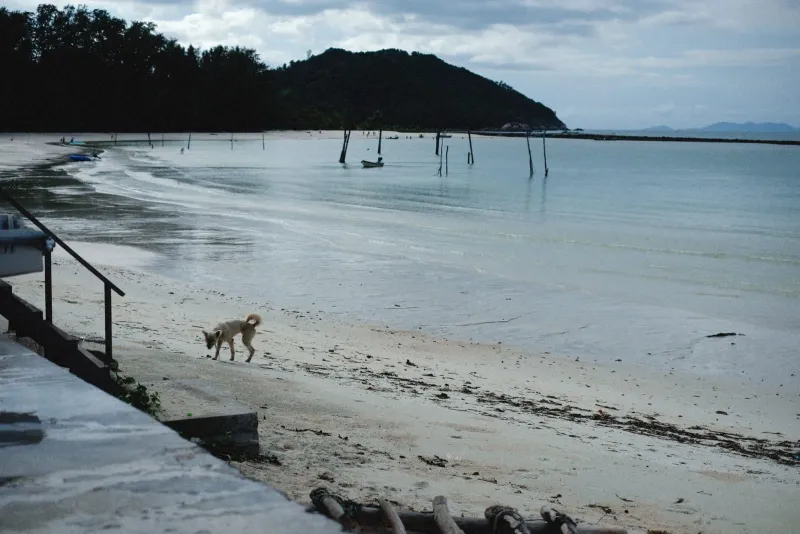
A quiet grey-sky beach in the low season

Budget

Poor high hotel prices, high crowds

Poor high hotel prices, high crowds

Good medium hotel prices, medium crowds

Good medium hotel prices, medium crowds

Great low hotel prices, low crowds

Great low hotel prices, low crowds

Great low hotel prices, medium crowds

Good medium hotel prices, medium crowds

Great low hotel prices, low crowds

Great low hotel prices, low crowds

Great low hotel prices, low crowds

Poor high hotel prices, high crowds

  1. January: Poor
  2. February: Poor
  3. March: Good
  4. April: Good
  5. May: Great
  6. June: Great
  7. July: Great
  8. August: Good
  9. September: Great
  10. October: Great
  11. November: Great
  12. December: Poor

Our hotel price band for the month (low, medium or high).

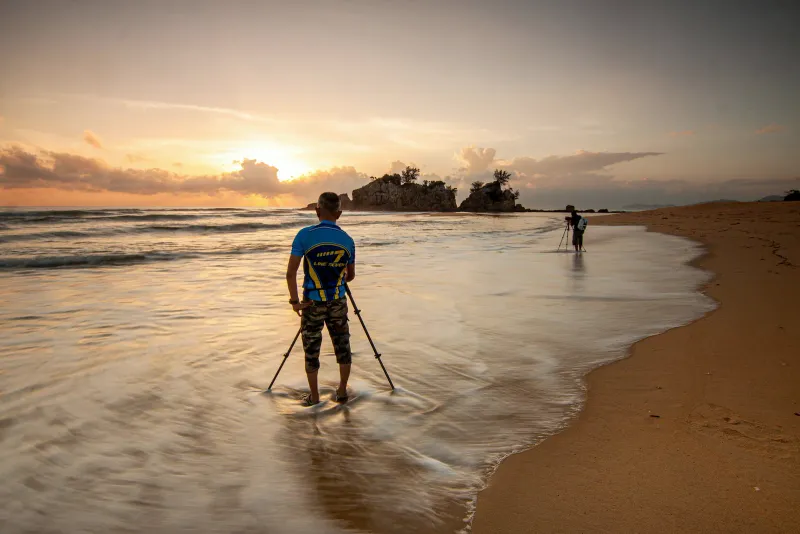
A photographer with a tripod at the water's edge at sunset

Photographers

Good 6.5 h of sun a day, sunset 18:18

Great 7.5 h of sun a day, sunset 18:29

Great 7.5 h of sun a day, sunset 18:31

Good 6.5 h of sun a day, sunset 18:30

Good 6 h of sun a day, sunset 18:33

Mixed 5 h of sun a day, sunset 18:40

Mixed 5 h of sun a day, sunset 18:45

Mixed 5 h of sun a day, sunset 18:38

Mixed 5 h of sun a day, sunset 18:21

Mixed 4.5 h of sun a day, sunset 18:03, storm skies

Good 6 h of sun a day, sunset 17:56, storm skies

Mixed 5.5 h of sun a day, sunset 18:02, storm skies

  1. January: Good
  2. February: Great
  3. March: Great
  4. April: Good
  5. May: Good
  6. June: Mixed
  7. July: Mixed
  8. August: Mixed
  9. September: Mixed
  10. October: Mixed
  11. November: Good
  12. December: Mixed

Sun hours a day (7 or more is great, 6 or more good); storm light from October to December.

The island's climate periods

Four overlapping seasons, measured at the Samui station from 1991 to 2020, set against the country's official calendar and the tourist rush.

Jan Feb Mar Apr May Jun Jul Aug Sept Oct Nov Dec Dry and sunny Feb - Apr Hot months Apr - Jun Light southwest monsoon Jun - Sept Northeast monsoon rains Oct - Dectail Thailand's official seasons WinterSummerRainyWinter Busiest, priciest (not climate) PeakPeak
Samui's year is shifted about two months against Bangkok and the Andaman coast: the rest of Thailand is in its cool, dry "winter" while Samui takes its heaviest rain. Sources: Land Development Department seasons of Thailand, 1991-2020 normals.
Dry and sunny February to March

Dry and sunny

Feb 65 mm over 4 days, 7.5 sun hours a day, calm water on all four coasts

The northeast monsoon has gone and the southwest one has not arrived. Least rain of the year (February 65 mm over 4 days, March 115, April 85), 7.5 hours of sun a day in February and March, calm sea on all four coasts.

Late March 2011 shows a dry-season month can still deliver 884 mm in four days (station), so 'driest' is a probability, not a guarantee. Peak tourist season runs Dec-Feb.

Hot months April to May

Hot months

May averages 32.9°C, records 38.0 in April and 38.2 in June

The year's highest temperatures: average highs 31.8 (April), 32.9 (May, the peak) and 32.7°C (June); the sea reaches 30°C and stays there to August. Nights stay 25 to 26°C. Samui's sea breeze keeps it milder than Bangkok (April high 35.7) or Phuket (34.2).

Days at 36°C or more are rising: 6 in 2016, 15 in 2023, 23 in 2025 by late August.

Light southwest monsoon June to September

Light southwest monsoon

100 to 135 mm a month, against 240 to 350 in Phuket

While the southwest monsoon soaks the Andaman side, Samui sits in the lee of the peninsula: 100 to 135 mm a month over 10 or 11 rain days, about 5 hours of sun a day, short showers of 20 to 60 minutes. West and south coasts turn choppy; the north stays calm.

The windiest months in the model record (daily highs about 20 to 21 km/h).

Northeast monsoon rains mid-October to mid-December

Northeast monsoon rains

October 295, November 445, December 265 mm

The northeast monsoon crosses the Gulf and empties on the east-facing coast: October 295 mm over 16 days, November 445 mm over 16 days (the wettest month), December 265 mm, January 125. Sun falls to 4.5 hours in October; east and west coasts turn rough.

Nearly every flood, ferry stop and landslide in our 20-year record falls in these months.

Samui, Phuket and Bangkok: three different rainy seasons

Rain by month on the same scale. The total for the year is close; the timing is opposite.

Average rain by month, millimetres, 1991-2020
PlaceJanuaryFebruaryMarchAprilMayJuneJulyAugustSeptemberOctoberNovemberDecemberYear
Koh Samui12764116831321341171021182954452631,994
Phuket502481135237249240309350336178822,272
Bangkok2421519321719919022733628945121,702
Samui is wet when Phuket dries out (November: Samui 445 mm, Phuket 178 mm) and the mild one in mid-year (June to September: 100 to 135 mm against Phuket's 240 to 350). WMO and Wikipedia climate tables, 1991-2020.

Weather risks

Should I worry?

What can go wrong, and how often it did

Most visits meet nothing worse than a wet afternoon. These are the hazards that can touch a trip, rated from what actually happened on Samui in the last 21 years, with what to do about each.

In season in

January: Flash floodsRough seas and ferry stopsTropical stormsLandslides

February: Rough seas and ferry stops

March: Water shortages

April: HeatWater shortages

May: HeatWater shortages

June: Heat

July: Water shortages

August: Water shortages

September: nothing in season

October: Flash floodsRough seas and ferry stopsTropical stormsLandslides

November: Flash floodsRough seas and ferry stopsTropical stormsLandslides

December: Flash floodsRough seas and ferry stopsTropical stormsLandslides

Pick a hazardFilled squares: years it happened, 2006 to 2026

Should I worry?

Flash floods

Plan around it

Likely in season to touch a trip

When

October, November, December, January

The record, 2006 to 2026

Heavy rain or floods in 13 of the last 21 years, almost all between October and January.

The worst it got

  1. 1 Streets under water for a few hoursmost monsoon years
  2. 2 Ring road flooded in many placesDec 2016: 17 spots, 1.2 m deep at Bo Phut
  3. 3 Airport shut, flights cancelledNov 2007, Nov 2010, Mar 2011
  4. 4 Island declared a disaster area2007, 2016, 2024

Keep a spare day before a flight home from October to January, stay off flooded roads (above all on a scooter) and check the Thai Meteorological Department's warnings.

GHCN station file, news and disaster-agency reports, 2006-2026.

Should I worry?

Rough seas and ferry stops

Plan around it

Likely in season to touch a trip

When

October, November, December, January, February

The record, 2006 to 2026

Boats stopped or red flags flew in 7 of the last 21 years.

The worst it got

  1. 1 Red flags, swimming bannedFeb 2026 on Chaweng and Lamai
  2. 2 Tao and Phangan boats stop, Samui's keep runningDec 2017, Nov 2025
  3. 3 Samui ferries stop tooMar 2011 (3 m waves), Jan 2019 (Pabuk)

Respect red flags: rip currents are the real danger (a tourist drowned off Samui on 2 Jan 2019 ignoring warnings). Keep island hopping flexible and swim on the calm coast of the day.

Ferry notices and news reports, 2011-2026.

Should I worry?

Heat

Plan around it

Likely in season to touch a trip

When

April, May, June

The record, 2006 to 2026

Days at 36°C or more: 6 in 2016, 15 in 2023, 14 in 2024, 23 in 2025 by late August.

The worst it got

  1. 1 Highs over 32°CMay and June on average
  2. 2 Days at 36°C or more23 in 2025, a record count
  3. 3 38°C at the station11 Apr 2016, the April record

Shade from 11:00 to 15:00, water and salts, beach early or late. Humidity of 78 to 86% makes it feel several degrees hotter than the air.

GHCN station file (TMAX), Wikipedia climate table (TMD extremes since 1968).

Should I worry?

Water shortages

Barely, in most hotels

Possible to touch a trip

When

March, April, May, July, August

The record, 2006 to 2026

Shortages in 2014, 2016, 2023 and 2026: demand is about 34,000 m³ a day against 16,000 from the mainland pipe.

The worst it got

  1. 1 Weak pressure in hillside areasmost dry spells
  2. 2 Taps dry for days, tanker waterMay 2014, Jul 2023
  3. 3 Supply rotated by zonemid-2016, Aug 2026

Hotels buy tanker water and you may not notice; hillside villas feel it first. Short showers help the whole island in a dry year.

Provincial Waterworks Authority notices via news reports.

Should I worry?

Tropical storms

Watch the forecast

Unlikely to touch a trip

When

October, November, December, January

The record, 2006 to 2026

About 5 storms made landfall on the Gulf coast since 1962; none is recorded as a direct hit on Samui.

The worst it got

  1. 1 Rough sea, outer rain bandsLinda 1997
  2. 2 Boats halted, islands cut offDurian 2006: 5,000 stranded on Phangan and Tao
  3. 3 All flights cancelled for two daysPabuk 2019: about 20,000 stuck on Samui
  4. 4 A direct hit on the islandnever recorded

Storms are forecast days ahead. If one is named for the Gulf, move flights early or sit tight: Pabuk's disruption lasted two days.

Wikipedia storm articles, Khaosod, Al Jazeera, AFP.

Should I worry?

Landslides

Only on hill roads after heavy rain

Unlikely to touch a trip

When

October, November, December, January

The record, 2006 to 2026

One deadly landslide on Samui in the record: two workers at a hillside building site in Maret, 15 Dec 2024.

The worst it got

  1. 1 Mud and rocks on hill roadsDec 2016 (a 20-ton boulder on Phangan)
  2. 2 Hillside buildings damagedMerit Resort villas, date unverified
  3. 3 Deaths2 in Dec 2024

After a night of heavy rain keep off steep hill roads and upper waterfall trails. The Department of Mineral Resources issues warnings by sub-district.

Khaosod English, Thaiger (unverified date), Matichon.

Should I worry?

Tsunami

No

Very unlikely to touch a trip

When

Any month, very rarely

The record, 2006 to 2026

None recorded in the Gulf. In 2004 the wave hit the six Andaman provinces; Samui felt only a tremor.

The worst it got

  1. 1 The 2004 quake felt as a tremor26 Dec 2004
  2. 2 A wave reaches the Gulf coastnever recorded

Nothing to plan for. The Gulf is shallow and sheltered; a modelled Manila Trench rupture takes 11.4 hours to reach southern Thailand, and the national warning centre can alert within about 15 minutes.

Wikipedia, Royal Thai Naval Academy journal model, NDWC.

Should I worry?

Earthquakes

No

Very unlikely to touch a trip

When

Any month, very rarely

The record, 2006 to 2026

Micro-quakes only: M2.4 and M2.2 near Bo Phut in 2024, M2.4 in November 2025. No damage.

The worst it got

  1. 1 Felt by residents, no damageMay 2024
  2. 2 Damagenever recorded

Nothing to plan for. Officials call the island geologically stable and ordered a seismometer after 2024.

Pattaya Mail, Department of Mineral Resources.

Should I worry?

Waterspouts

No

Very unlikely to touch a trip

When

Any month, very rarely

The record, 2006 to 2026

None verified on or off Samui. Nearby cases: Koh Samet in 2017, Phetchaburi in 2023.

The worst it got

  1. 1 Seen offshorenot recorded here

Nothing to plan for.

English and Thai news searches; no official statistics exist.

History

Twenty years, as it happened

What the weather actually did to Samui

Every flood, storm, drought and heat record we could check since 2006, from the island's weather station, news reports and disaster agencies, then the big ones before. Each entry says how sure we are.

  • 16heavy-rain and flood episodes
  • 3disaster-area declarations, 2007, 2016 and 2024
  • 4times flights stopped: 2007, 2010, 2011, 2019
  • 2storms that cut the islands off: 2006, 2019
  • 4water shortages: 2014, 2016, 2023, 2026
  • 0tsunamis in the Gulf

Tap any mark to read what happened. Rows are years, columns months: see how the floods line up from October to January.

JanJFebFMarMAprAMayMJunJJulJAugASeptSOctONovNDecD 2026'26 2025'25 2024'24 2023'23 2022'22 2021'21 2020'20 2019'19 2018'18 2017'17 2016'16 2015'15 2014'14 2013'13 2012'12 2011'11 2010'10 2009'09 2008'08 2007'07 2006'06
  • Floods and landslides
  • Heat and cold records
  • Storms and rough seas
  • Quakes and tsunami
  • Water shortages
  • Verified
  • Station record only
  • Unverified

2026

Water shortages Verified 27 July 2026 Dry-spell water shortage, rotating supply from 3 August

On Samui

A prolonged dry spell (El Nino cited) emptied local raw-water sources and cut tap-water production by about 40 percent. Disruptions reported from 27 July, worst in higher areas. The PWA Samui branch started rotating supply (a yellow zone and a red-green zone) for seven days from 3 August; some communities had weak pressure or no running water for several days and families bought tanker water. Whether rationing went on after the first seven days: unverified.

Impact

Demand about 34,000 m3/day against about 16,000 m3/day through the mainland pipeline (shortfall 18,000). PWA trucked 16,000 m3/day from its Surat Thani branch and added 4,000 m3/day via the underwater pipeline; a damaged reverse-osmosis plant was being repaired; cloud seeding was requested; hotels and larger businesses bought tanker water in peak season. Deputy Interior Minister ordered a long-term water security plan.

Sources: pattayamail.com, aseannow.com, bluewin.ch. Confidence: verified (3 sources).

Storms and rough seas Verified 19 February 2026 Cold-air surge: strong winds, red flags on Chaweng and Lamai

On Samui

Cold air over the Gulf with easterly and southeasterly winds converging. Waves about 1-2 m on Chaweng and Lamai (above 2 m in thunderstorms); lifeguards and hotels raised red flags and swimming was banned along the whole shoreline because of rip currents.

Impact

Ferries to and from Samui kept running, delays possible; forecast to last until 20-21 Feb. No damage reported.

Sources: khaosodenglish.com. Confidence: verified (1 source).

2025

Storms and rough seas Verified 19 November 2025 to 27 Nov 2025 Northeast-monsoon surge during the Cyclone Senyar floods: Tao sailings halted, Samui largely unaffected

On Samui

Surat Thani-Koh Tao and return ferries were suspended 19-21 Nov for strong winds and high waves; Lotus, Lomprayah and express boats also cancelled single sailings. A TAT-based update of 27 Nov says tourists on Ko Samui, Ko Pha-ngan and Ko Tao enjoyed uninterrupted activities with hotels, transport and attractions operating normally despite strong winds and waves, and airports in the region were operating with limited delays.

Impact

The disaster was elsewhere: Hat Yai had 335 mm in one day on 21 Nov 2025 (heaviest in at least 300 years), Thailand at least 297 deaths (229 in Songkhla) from Cyclone Senyar, a rare Malacca Strait system. The ferry notice also quoted a forecast of over 1,000 mm in ten days for the region (a forecast, not a Samui measurement).

Sources: pattayamail.com, pattayamail.com, en.wikipedia.org. Confidence: verified for ferries and TAT status; Samui rainfall unknown (GHCN file ends 23 Aug 2025).

Heat and cold records Partly verified 1 June 2025 Three hot seasons in a row, record count of days at 36 C or more

On Samui

Samui station Tmax 37.9 C on 1 Jun 2025 (highest since 38.0 C on 11 Apr 2016). Days at or above 36 C: 23 in 2025 up to 23 Aug, 14 in 2024, 15 in 2023, against 0 to 6 in most earlier years; days at or above 35 C: 50 in 2025 up to 23 Aug. Other 2023-25 peaks: 37.7 (5 Jul 2023), 37.3 (28 Jun 2023, 15 Jun 2024), 37.2 (20-21 May 2023).

Impact

Long-term monthly record highs (TMD extremes since 1968, via Wikipedia): Jan 33.4, Feb 35.1, Mar 36.0, Apr 38.0, May 37.8, Jun 38.2, Jul 37.7, Aug 37.2, Sep 36.4, Oct 35.8, Nov 34.0, Dec 32.3 C. A travel blog says 37.2 C in May 2023 broke the island record; the station file shows higher values earlier (38.0 in 2016), so that claim is unverified. Missing days in the file mean counts are lower bounds.

Sources: ncei.noaa.gov, en.wikipedia.org. Confidence: verified from station file; blog record claim unverified.

2024

Floods and landslides Verified 13 December 2024 to 17 Dec 2024 Heavy rain, fatal landslide, Samui and Phangan declared disaster areas

On Samui

Station: 87 mm on 12 Dec, 96 mm on 13 Dec, 207.8 mm on 14 Dec (largest daily total in the file since 28 Mar 2011), 81 mm on 16 Dec; 530 mm on 10-17 Dec (8 days of data). The Department of Mineral Resources issued a landslide warning for Samui sub-districts on 14 Dec. About 04:30 and 05:40 on 15 Dec two landslides hit a villa-construction workers' camp on Himatong Soi, Moo 1, Maret sub-district (hillside); two Myanmar workers (aged 19 and 39) were found dead 10 m away; work suspended. On 16 Dec Surat Thani declared eight districts disaster areas, including Koh Samui and Koh Phangan, after three days of heavy rain plus runoff from the Nakhon Si Thammarat range.

Impact

2 deaths (landslide). A Thaiger headline reports 8 villas collapsing at Merit Resort Samui after rain and a landslide on an early Saturday; its date could not be confirmed (it could be 14 Dec 2024 or 13 Nov 2021): unverified. Airport and ferry status in Dec 2024: not found.

Sources: khaosodenglish.com, pattayamail.com, ncei.noaa.gov. Confidence: verified (2 sources + station).

Quakes and tsunami Verified 30 May 2024 Three micro-earthquakes near Bo Phut

On Samui

M2.4 at 08:24 on 30 May (Ang Thong sub-district, 4 km deep; the Department of Mineral Resources linked it to geothermal energy), then two more on Saturday 1 June (Pattaya Mail: M2.4 and M2.2; the M2.2 struck at 08:31, 2 km deep, in Bo Phut). Felt by residents in Ang Thong, Bo Phut and Na Mueang; no damage, no aftershocks. The Natural Resources Minister ordered a seismometer for the island; seismology officials said Samui is geologically stable. Another M2.4 at 00:47 on 13 Nov 2025 (9.550N 99.956E) was heard as a loud boom and felt in Bo Phut.

Impact

None. Officials: unlikely to see significant seismic activity.

Sources: pattayamail.com, pattayamail.com, infoquest.co.th, thansettakij.com. Confidence: verified.

2023

Water shortages Verified 2 July 2023 Freshwater shortage: about 30 days of local supply left

On Samui

Bangkok Post, 2 Jul 2023: low rainfall and high demand left the island with about 30 days of local freshwater; Phru Na Mueang and Phru Krajud reservoirs and the Hin Lad waterfall were sharply down; taps ran dry for days; locals paid 250-300 baht for about 2,000 litres. The deputy mayor asked residents and tourists to save water so the province would not declare a disaster zone; El Nino was expected to make it worse.

Impact

PWA stations could make about 15,000 m3/day and the 250-300 baht price came from the Bangkok Post piece (both seen only through a search summary, the page is paywalled); more underwater-pipeline supply from the mainland planned. SCMP (13 Jul 2023): the shortage dates from the mid-1990s.

Sources: dailyo.in, scmp.com, bangkokpost.com. Confidence: verified (secondary reports of Bangkok Post, which is paywalled).

2021

Floods and landslides Partly verified 12 November 2021 to 7 Dec 2021 November 2021 floods: Samui and Phangan among 13 Surat Thani districts

On Samui

Station: 160 mm on 12 Nov and 152 mm on 13 Nov (467 mm on 9-15 Nov), 141 mm on 29 Nov, November total 1,079 mm (29 days of data). Surat Thani floods from 23 Nov hit 13 districts including the island districts Koh Samui and Koh Phangan; by 2 Dec 6,134 households (18,712 people) were affected across the province. Thaiger reports a hillside landslide that collapsed 8 villas at Merit Resort Samui on an unconfirmed Saturday (13 Nov 2021 was a Saturday): unverified.

Impact

AHA Centre 23 Nov-7 Dec: 70,771 households in 10 provinces, 2 deaths (1 in Surat Thani, 1 in Chumphon).

Sources: bangkokbiznews.com, adinet.ahacentre.org, floodlist.com, ncei.noaa.gov. Confidence: verified (province report + station); resort landslide date unverified.

2019

Storms and rough seas Verified 3 January 2019 to 5 Jan 2019 Tropical Storm Pabuk
Pabuk from space, one frame a day, 30 Dec 2018 to 8 Jan 2019. Tap to play. NASA Worldview, public domain.

On Samui

Russian tourist drowned off Koh Samui on 2 Jan ignoring warnings. On 3-4 Jan Bangkok Airways cancelled all Samui flights and Gulf ferries were suspended (2 days); Surat Thani airport closed from the afternoon of 4 Jan to Saturday noon; red flags and swimming bans on Samui, Phangan and Tao; NDWC alarms urged people in high-risk beach areas to move to higher ground. Waves up to 3 m reaching far inland on Samui (Al Jazeera), up to 5 m offshore (AFP); power blackout across swathes of Surat Thani and Nakhon Si Thammarat. About 20,000 tourists were stuck on Samui (island chief), 15,000 on Tao and 4,000 on Phangan (Khaosod; AFP said 10,000 on Phangan). The eye passed over Nakhon Si Thammarat (landfall Pak Phanang 12:45 on 4 Jan), so the islands avoided a direct hit. Station 124.5 mm on 4 Jan.

Impact

Flights and ferries resumed on Saturday 5 Jan, Bangkok Airways added extra flights. Thailand: 8 deaths (10 including Vietnam and Malaysia), about US$95 million damage; first tropical storm to make landfall in southern Thailand since Linda in 1997 (Wikipedia). A search summary of AP says over 28,000 people sheltered in seven provinces (unverified).

Sources: khaosodenglish.com, aljazeera.com, thejakartapost.com, theaseanpost.com. Confidence: verified (5 sources).

2018

Floods and landslides Partly verified 16 December 2018 to 18 Dec 2018 December 2018 rains: Ko Samui among 8 flooded Surat Thani districts

On Samui

Station 113 mm on 16 Dec (December total 669 mm). AHA Centre 18 Dec lists Ko Samui district among the eight Surat Thani districts flooded (with Tha Chang, Chaiya and others).

Impact

Worst on the mainland: Nakhon Si Thammarat 377 villages in 17 districts, 1 dead and 1 missing (FloodList, 16-18 Dec).

Sources: adinet.ahacentre.org, floodlist.com. Confidence: verified list entry; depth and damage unverified.

2017

Storms and rough seas Partly verified 20 December 2017 to 21 Dec 2017 Rough seas: Don Sak boats to Phangan and Tao suspended, waves up to 4 m

On Samui

Passenger boats from Don Sak pier to Koh Phangan and Koh Tao stayed suspended for a second day on Thursday 21 Dec with waves up to 4 m; boats to Koh Samui could still leave but daytime sailings depended on sea conditions; the governor ordered marine police to the pier. Typhoon Tembin (Vinta) was in the South China Sea on 24-25 Dec and hit southern Vietnam (Vietnam Airlines cancelled flights on 25 Dec); its path through the Gulf and any Samui effect are unverified. Samui station rain 27, 50 and 24 mm on 26-28 Dec.

Impact

No casualties found for Samui in this episode.

Sources: nationthailand.com, en.wikipedia.org. Confidence: verified for ferries (1 source); the later Tembin link is unverified.

Floods and landslides Verified 1 January 2017 to 8 Jan 2017 January 2017 floods (second wave after December 2016)

On Samui

Rain from 1 Jan; station 44 mm on 4 Jan, 159.3 mm on 5 Jan, 56 mm on 6 Jan (352 mm on 1-8 Jan). Flooded roads and an overflowing lake on the island, tourists floating on inflatables, traffic snarled and flights to and from Samui delayed (AP, 5 Jan). Boat services between the Gulf islands (ferry, speedboat, longtail) discontinued until conditions improved; Na Muang and Hin Lat waterfalls closed on 6 Jan; a guesthouse owner called it the worst flooding on the island in over a decade; Samui and Phangan deluged in peak season (AFP, 6 Jan).

Impact

South-wide: 8 dead and 120,000 households by 6 Jan (AFP); at least 25 dead and 1.1 million affected by 10 Jan (Deccan Herald, seen only in a search summary); final 96 deaths, about 1.8 million people and roughly 120 billion baht damage across 12-13 provinces (Wikipedia, DDPM). Nakhon Si Thammarat airport shut for two days, main southbound road cut, trains stopped.

Sources: gulfnews.com, foxnews.com, en.wikipedia.org, 12go.com. Confidence: verified (4 sources).

2016

Floods and landslides Verified 1 December 2016 to 10 Dec 2016 December 2016 floods: ring road under water, Samui and Phangan disaster areas

On Samui

Rain from 1 Dec. On Sat 3 Dec the TMD Samui station measured 90.4 mm from the afternoon of 2 Dec; 17 spots on the ring road (Highway 4169) flooded, worst at Big C in Bo Phut about 1.2 m deep over 200 m and Chaweng (Wat Sawang Arom to the post office) about 50 cm over 1 km. Station daily totals: 175 mm (3 Dec), 144 mm (7 Dec), 493 mm on 1-10 Dec. By 6 Dec the Phru Chaweng swamp overflowed onto Chaweng Beach Road, 40-50 cm deep; hotels lost water and power; boats were laid on to reach the airport and flights were delayed, ferries kept running; Samui and Phangan were declared disaster areas. On Phangan a 20-ton boulder and four power poles blocked a road for about 4 hours. Officials blamed rubbish blocking drains, building across waterways and high tide slowing drainage; a shop owner on Chaweng said the water was under 1 m against over 2 m in 2011.

Impact

South-wide: 11 dead by 5 Dec, 14 by 7 Dec (2 in Surat Thani), 350,000 people in 10 provinces; parts of 11 provinces declared disaster zones; UK FCO warned of widespread flooding incl. Koh Samui and Koh Phangan.

Sources: matichon.co.th, thaipbs.or.th, matichon.co.th, khaosodenglish.com. Confidence: verified (6 sources + station).

2014

Water shortages Verified 5 May 2014 Taps dry after months of low rain

On Samui

Koh Samui Waterworks office scrambled as taps ran dry in some areas after several months of low rainfall; untreated water available fell from 31,800 to 21,600 m3/day.

Impact

A raw-water pipe project was due to finish in 2016.

Sources: reliefweb.int. Confidence: verified (1 source).

2012

Floods and landslides Verified 26 November 2012 to 27 Nov 2012 November 2012 downpour floods much of the island

On Samui

Downpour early on 26 Nov flooded many areas, some up to 30 cm; officials kept key tourist roads clear but most of the island flooded. District chief put staff on 24-hour alert. Station 105.2 mm on 26 Nov.

Impact

Samui-mainland ferries not disrupted, but surges up to 2 m were forecast. Heavy rain warned for the whole East and South until 28 Nov.

Sources: pattayamail.com. Confidence: verified (1 source + station).

2011

Floods and landslides Verified 27 March 2011 to 1 Apr 2011 Late-March 2011 floods: airport shut, ferries halted, thousands stranded

On Samui

Station rain: 177 mm (27 Mar), 307 mm (28 Mar, the wettest March day on record), 252 mm (29 Mar), 147 mm (30 Mar) = 884 mm in four days and 1,069 mm in the seven days to 30 Mar; March total 1,137 mm against a normal 115 mm. Flash floods came down from the hills after days of rain; the mayor called it the worst in a decade (ScandAsia, seen only in a search summary). Samui airport suspended services indefinitely because roads around it flooded and a power blackout hit the airport; Bangkok Airways cancelled 36 flights on 28 Mar and all 53 on 29 Mar; ferries halted by 3 m waves between Samui and Surat Thani; FireFly suspended Subang flights. Bangkok Airways said about 2,000 people (mostly tourists) were stuck at the airport or in hotels; AFP-based reports put stranded tourists at 13,000 to 15,000. Flights and ferries resumed on 30-31 Mar; the mayor said 80 percent of the island was back to normal by 1 Apr, Chaweng the worst hit with pumps deployed.

Impact

At least 21 dead in the south by 30 Mar (3 along the Surat Thani coast); later tolls at least 53, roughly 9 million affected and over US$500 million damage (Wikipedia). Thai Airways flew three relief flights (600 passengers) and Bangkok Airways 19 flights (about 2,000 passengers). March normally brings about 115 mm over 4-5 days.

Sources: aljazeera.com, ttgasia.com, nbcnews.com, travelmole.com. Confidence: verified (5 sources + station).

2010

Floods and landslides Partly verified 2 November 2010 to 23 Dec 2010 Autumn 2010: 315 mm in a day, airport shut, tourists stranded on Ang Thong

On Samui

Station: 315.2 mm on 2 Nov (the biggest daily total at the station since 24 Nov 1988), 278 mm on 9 Nov, November total 1,113 mm and December 936 mm. On 2-3 Nov Samui airport suspended services after the runway flooded and Bangkok Airways could not say when service would resume (flights set to resume that afternoon, with a backlog); about 100 foreign tourists were stranded on Ang Thong island by high waves.

Impact

Thailand-wide 2010 floods: 232 deaths by 19 Nov, about 50 billion baht damage (Wikipedia); 76 deaths in the South.

Sources: c9hotelworks.com, en.wikipedia.org, ncei.noaa.gov. Confidence: verified for airport (2 sources); other impacts unverified.

2007

Floods and landslides Verified 7 November 2007 to 8 Nov 2007 November 2007: island declared a disaster zone, airport suspended

On Samui

Heavy rain the night of 7 Nov flooded several locations; flood levels up to 1 m in parts of the commercial centre and tourist sites, 30 cm on the main road. Samui declared a disaster zone on Thursday 8 Nov. Airport suspended service that morning, more than 1,000 travellers stranded (hundreds per another line of the same text); weather had stopped aircraft from taking off since late Wednesday. Station 138 and 105 mm on 7-8 Nov (also 324 mm on 22-24 Oct 2007).

Impact

Ferries ran as usual. Authorities pumped water into rivers.

Sources: aseannow.com. Confidence: verified (Bangkok Post / TNA text on a forum; 1 source + station).

2006

Storms and rough seas Verified 5 December 2006 to 6 Dec 2006 Depression Durian crosses the Gulf: boats halted, 5,000 stranded on Phangan and Tao

On Samui

After devastating the Philippines and southern Vietnam as Typhoon Durian, it entered the Gulf as a depression about 50 km east of Samui on 6 Dec and made landfall over Surat Thani and Nakhon Si Thammarat. Heavy rain on Samui, Phangan and Tao; all boat services halted except Samui ferries; about 5,000 tourists stranded on Phangan and Tao. Station 46 mm on 6 Dec and 45 mm on 8 Dec.

Impact

Local civil defence on standby for landslides. No Samui casualties found.

Sources: aseannow.com, en.wikipedia.org. Confidence: verified (1 source) + station.

2025

Floods and landslides Station record 23 February 2025 to 24 Feb 2025 Out-of-season downpour (dry season)

On Samui

Samui station 155.7 mm on 24 Feb, one of the 30 wettest days in its 1973-2025 record. AHA Centre: heavy rain flooded Ban Tai, Koh Phangan at 15:00 on 24 Feb (1 household initially) and the Koh Samui provincial disaster office helped move belongings; no Samui-specific flood report found.

Impact

3 provinces (Surat Thani, Nakhon Si Thammarat, Narathiwat), 279 households, no injuries or deaths (AHA Centre).

Sources: adinet.ahacentre.org. Confidence: station verified; Samui damage unverified.

Floods and landslides Unverified 12 January 2025 Surat Thani flooding lists Koh Samui and Koh Phangan districts

On Samui

AHA Centre report of 12 Jan 2025 names Koh Samui District and Koh Phangan District among affected areas of Surat Thani (with mainland sub-districts). No depth, damage or transport detail found. Station January 2025 total 141 mm over 12 days with data.

Impact

unverified

Sources: adinet.ahacentre.org. Confidence: unverified detail (AHA Centre list only).

2022

Floods and landslides Station record 4 April 2022 to 4 Dec 2022 A wet 2022: repeated heavy-rain days in April, May, November and December

On Samui

Station: 106 and 114 mm on 4-5 Apr, 126 mm on 4 May (May total 475 mm), 159 mm on 5 Nov (275 mm on 4-7 Nov), 92 and 139 mm on 3-4 Dec. FloodList for 4-5 Apr: Surat Thani 473 families in 36 villages of 2 districts (districts not named). For 5 May: Tha Chang, Chaiya, Wiphawadi (mainland). No Samui news found for these dates.

Impact

Nakhon Si Thammarat took the brunt in April (184 mm in 24 h to 4 Apr). Dec 2022: 9 southern provinces flooded after 545 mm in a day at Narathiwat on 18 Dec.

Sources: floodlist.com, floodlist.com, floodlist.com, ncei.noaa.gov. Confidence: station verified; Samui impacts unverified.

2020

Floods and landslides Station record 1 December 2020 Late-2020 floods in the south: heavy rain on Samui, impacts unverified

On Samui

Station: 38.6, 58.4 and 75.2 mm on 1-3 Dec (172 mm in three days) and 98.8 mm on 13 Nov. No Samui news article for this event was found (searches in English and Thai returned the Dec 2016 coverage instead).

Impact

TMD Surat Thani 296.9 mm in 24 h to 2 Dec. AHA Centre 4 Dec: floods and landslides in 11 provinces since 25 Nov, 553,715 households, 20 deaths; FloodList: 302,110 households in 7 provinces, 8 dead in Nakhon Si Thammarat.

Sources: floodlist.com, adinet.ahacentre.org, reliefweb.int, ncei.noaa.gov. Confidence: station + regional verified; Samui-specific impacts unverified.

2018

Floods and landslides Station record 11 January 2018 Heavy-rain day in January 2018 (news not found)

On Samui

Station 177.3 mm on 11 Jan, 17.8 mm on 12 Jan; January 2018 total 281 mm. No article found for Samui.

Impact

unverified

Sources: ncei.noaa.gov. Confidence: station only; impacts unverified.

2017

Floods and landslides Station record 2 November 2017 to 4 Nov 2017 Early-November 2017 downpour (news not found)

On Samui

Station 147.1, 114.8 and 42.7 mm on 2-4 Nov (305 mm); 138 mm on 30 Nov; November total 759 mm.

Impact

unverified

Sources: ncei.noaa.gov. Confidence: station only; impacts unverified.

2016

Water shortages Unverified July 2016 Reservoirs near empty, zoned rationing: 'worst water crisis in 10 years'

On Samui

Bangkok Post 'Taps tightened on Koh Samui' (article id 1099441, which fits about July 2016) and a zoning story: the PWA branch manager called it the island's worst water crisis in 10 years; three reservoirs held 988,000 m3 of a 4.6 million m3 capacity; tap water rationed by zone to households and businesses. A separate Oct 2016 report put daily demand at 30,000 m3 and the two Pru Krajude reservoirs at up to 800,000 m3 combined.

Impact

unverified

Sources: bangkokpost.com. Confidence: unverified date; claim taken from Bangkok Post headlines/snippets (paywalled, not read).

Heat and cold records Station record 11 April 2016 Strong El Nino hot season: 38.0 C at the station

On Samui

Tmax 38.0 C on 11 Apr and 37.7 C on 12 Apr 2016; 24 days at or above 35 C and 6 at or above 36 C that year. Rainfall in Jan-May 2016 was very low (April 2 mm over 4 days with data).

Impact

Probably a factor in the mid-2016 water crisis (our inference, not a sourced link).

Sources: ncei.noaa.gov. Confidence: station verified (matches Wikipedia April record).

2014

Heat and cold records Station record 3 February 2014 Coldest night of the record: 17.8 C

On Samui

Tmin 17.8 C on 3 Feb 2014 and 18.7 C on 4 Feb (station file). Wikipedia lists 17.8 C as the February record low and the lowest of any month.

Impact

none found

Sources: ncei.noaa.gov, en.wikipedia.org. Confidence: station verified (equals Wikipedia February record low).

2008

Floods and landslides Station record 9 November 2008 to 24 Nov 2008 November 2008 heavy rain (news not found)

On Samui

Station 108 and 211 mm on 9-10 Nov, 144 mm on 24 Nov; November total 941 mm.

Impact

unverified

Sources: ncei.noaa.gov. Confidence: station only; impacts unverified.

Days at 36°C or moreSamui station, by year
  1. 6 16
  2. n/a 17
  3. n/a 18
  4. 6 19
  5. 4 20
  6. 6 21
  7. 1 22
  8. 15 23
  9. 14 24
  10. 23 25*

*2025 counted to 23 August. The station file gives no count for 2017 and 2018 and has missing days, so read these as lower bounds.

The station's ten wettest daysMillimetres in 24 hours, since 1973
  1. 24 Nov 1988 464.1
  2. 8 Jan 1975 389.9
  3. 7 Jan 1975 340.1
  4. 2 Nov 2010 315.2
  5. 28 Mar 2011 307.3
  6. 9 Nov 2010 278.1
  7. 29 Mar 2011 252
  8. 6 Jan 1975 249.9
  9. 19 Nov 1979 230.1
  10. 10 Nov 1988 220

24 Nov 1988 brought 464 mm in one day: more than a normal November (445 mm). Station totals after 2005 are lower bounds because of missing days.

The 50-year view

Before 2006 the record thins out to the station file and the big storms. They set the scale: the island's wettest day, the deadliest storm in Thai history, and the tsunami that never reached the Gulf.

How close the Gulf's storms cameDistance from Samui to where each storm crossed the coast
  1. Durian 2006 50 km Passed about 50 km east as a depression. Boats halted, 5,000 stranded on Phangan and Tao.
  2. Harriet 1962 130 km Landfall at Pak Phanang, about 130 km south. 935 dead, Thailand's deadliest storm.
  3. Pabuk 2019 130 km Landfall at Pak Phanang, about 130 km south. All Samui flights cancelled for two days.
  4. Gay 1989 about 140 km Landfall on the Chumphon coast to the north-west. 529 dead in Thailand, the first typhoon since 1891.
  5. Linda 1997 not confirmed Landfall point not confirmed. 164 dead in Thailand, most of them fishermen at sea.

No storm is recorded as a direct hit on Samui. Gay's distance is measured to Chumphon town, the others come from the reports.

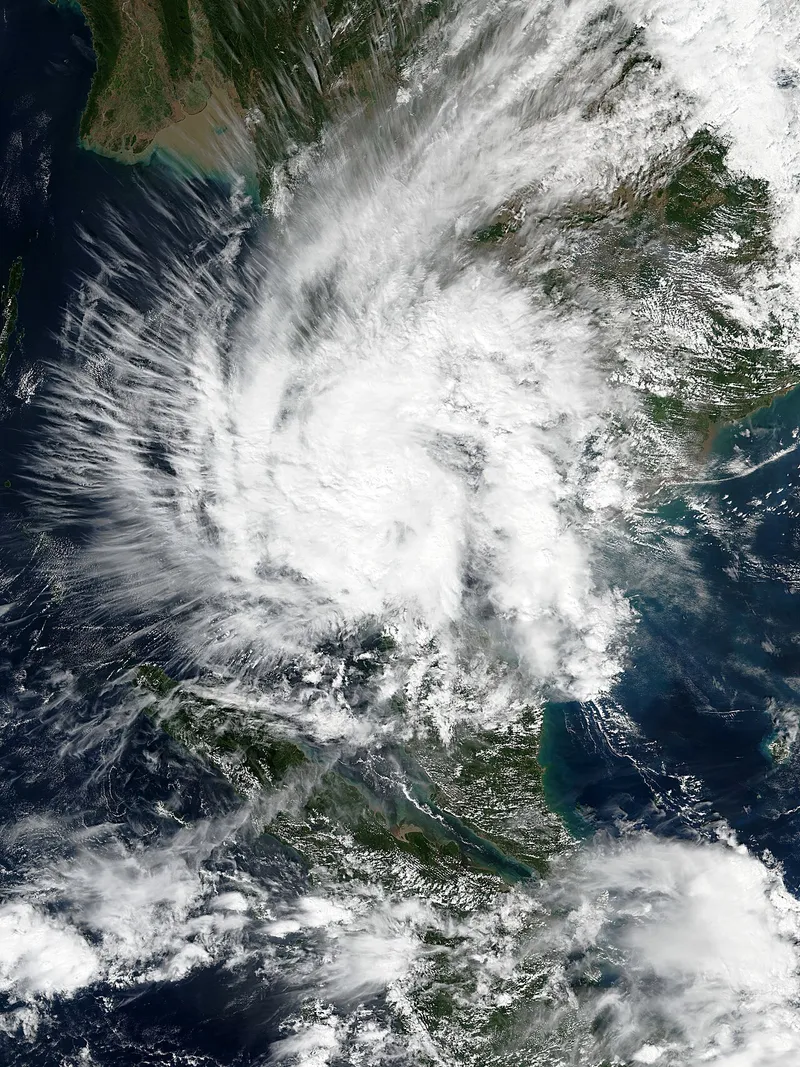
Satellite image of Tropical Storm Pabuk over southern Thailand on 4 January 2019
Pabuk making landfall on 4 Jan 2019, seen by NOAA's Suomi NPP satellite (public domain). Samui lies under the storm's northern bands.
  1. 2004

    Quakes and tsunami Verified

    Indian Ocean tsunami: Andaman coast devastated, Samui only felt a tremor

    A 2004 travel report said Samui was slightly shaken by the quake with no damage and no tidal wave; the Gulf coast was not hit.

  2. 1997

    Storms and rough seas Partly verified

    Typhoon Linda (Gulf crossing)

    Linda became a minimal typhoon in the Gulf and struck mainland Thailand late on 3 Nov as a tropical storm with 105 km/h winds (landfall point not confirmed here). Samui station 39 mm (31 Oct) and 66 mm (1 Nov): outer bands only.

  3. 1989

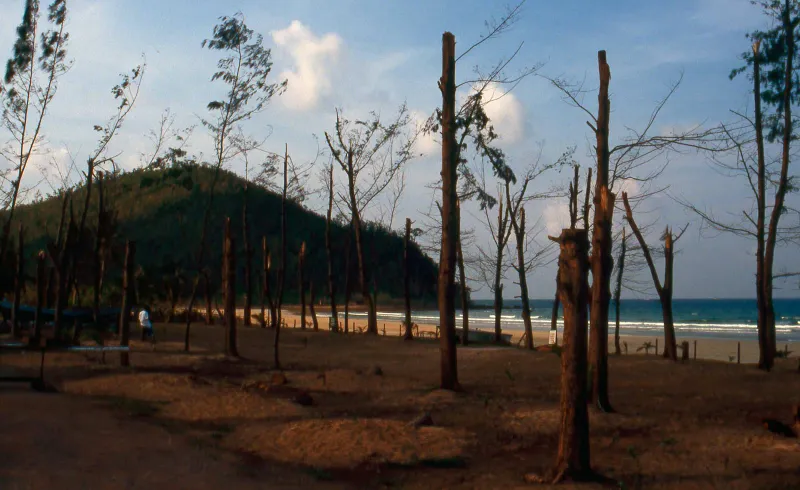
    A beach resort on the Chumphon coast destroyed by Typhoon Gay in 1989

    Storms and rough seas Partly verified

    Typhoon Gay: first typhoon to hit Thailand since 1891, landfall at Chumphon

    Passed north of Samui and landed at Chumphon on 4 Nov (06:00 UTC) with 185 km/h winds; swells of 6-11 m in the Gulf sank the drillship Seacrest; many wooden schools in Chumphon and Surat Thani provinces were destroyed. Samui station: 70 and 75 mm on 3-4 Nov.

  4. 1988

    Floods and landslides Station record

    November 1988 southern floods: the station's all-time daily record (464 mm)

    Samui station recorded 220 mm (10 Nov), 146 mm (11 Nov), 143 mm (15 Nov), 189 mm (22 Nov) and 464.1 mm on 24 Nov 1988, the biggest daily total in the 1973-2025 record; 1,320 mm in 16 days. On the mainland landslides at Phipun and Lan Saka on 22 Nov 1988 were deadly (Wikipedia's list of disasters, read only through a search summary: 230 deaths or injuries at Phipun, 12 deaths at Lan Saka).

  5. 1975

    Floods and landslides Station record

    January 1975 deluge (before the 1976 window)

    Station 250, 340 and 390 mm on 6-8 Jan 1975 (980 mm in three days), a January record.

  6. 1962

    Storms and rough seas Verified

    Tropical Storm Harriet: the classic Gulf reference

    Made landfall at Laem Talumphuk, Pak Phanang, Nakhon Si Thammarat (about 130 km south of Samui) on 25 Oct 1962 with 95 km/h winds; storm surge wiped out villages. No early-warning system existed.

FAQ

Common questions

Before you ask about the weather

Is it the rainy season on Koh Samui right now?

From October to December, yes: the northeast monsoon brings Samui's wet season, peaking in November with 445 mm over 16 days. June to September is only lightly wet here while the Andaman coast takes heavy rain, and February to April is the dry season.

Does rain mean the whole day is washed out?

Rarely. Even November averages 14 dry days, and most rain comes in heavy bursts rather than all day. In the mid-year months showers typically last 20 to 60 minutes. Plan beach time around the sky, not the calendar.

What is the wettest month, and which should I avoid?

November: 445 mm over 16 days on average, with rough seas on the east and west coasts. October and December are wet too (295 and 265 mm). If rain is a dealbreaker, come from February to April, when February sees just 65 mm over 4 days.

Is the sea swimmable all year?

The water stays between 28 and 30°C all year. From January to August at least two coasts are calm; in October and November none are reliably calm, so swim on the sheltered side of the day and never under a red flag.

Will a typhoon hit Koh Samui?

It is rare. About five tropical storms made landfall on the Gulf coast since 1962 and none is recorded as a direct hit on the island. The worst recent one, Pabuk in January 2019, cancelled every flight for two days and left about 20,000 tourists waiting on Samui.

Is there a tsunami risk on Koh Samui?

Very low. Samui is on the Gulf side of the peninsula: the 2004 Indian Ocean tsunami hit the Andaman coast and left the Gulf untouched. A modelled Manila Trench rupture would take about 11 hours to reach southern Thailand.

How current are these figures?

Monthly figures are the 1991-2020 averages for the Ko Samui station (WMO 48550). The history runs to October 2026 from the station file, news and disaster agencies. Where this page says typical, it shows those averages, not a forecast.

What is the best month to visit Koh Samui?

February to April for the driest, sunniest weather and calm seas all round. July and August are a good-value compromise: about 100 to 115 mm of rain a month, warm sea and lower prices, while Phuket takes its heaviest rain.

Sat31Oct

A typical October day

31°Rain likely

  • 30.6° / 24.3°
  • 52% chance
  • Sea 29°C
  • Sunset 17:58
Back to right now

October in numbers

Highs
30.6°C
Rain
295 mm
Rain days
16
Sun
4.5 h
Sea
29°C
Calm coasts
0 of 4

Next: November, 445 mm over 16 rain days.

Next risk seasons

  1. October to JanuaryFlash floods, Rough seas and ferry stops, Landslides
  2. March to AugustWater shortages
  3. April to JuneHeat
Should I worry?

The Samui69 letter

A free email about Koh Samui now and then: new guides, events and seasons.

Free, no spam, unsubscribe anytime. Read our Privacy.